Hot or not?

About this lesson
This lesson sequence focuses on the incremental or Agile approach to development and encourages students to follow the evolution of a temperature conversion tool for a Food Technology teacher. It uses an Excel spreadsheet application as the prototyping tool.
Year band: 9-10
Curriculum Links AssessmentCurriculum Links
Links with Digital Technologies Curriculum Area
| Strand | Content Description |
|---|---|
| Processes and Production Skills |
Define and decompose real-world problems with design criteria and by interviewing stakeholders to create user stories (AC9TDI10P04). Design and prototype the user experience of a digital system (AC9TDI10P07). Generate, modify, communicate and critically evaluate alternative designs (AC9TDI10P08). |
Assessment
Note: Criteria are cumulative
| Quantity of knowledge | Quality of understanding | ||||
|---|---|---|---|---|---|
| Evolutionary prototype using spreadsheet | No evidence of understanding | Student creates non-working initial iteration | Student creates working initial iteration | Student demonstrates ability to respond to user feedback to improve the prototype | Student demonstrates ability to suggest features to user and to respond to user feedback to achieve a finalised prototype acceptable to the user |
| Optional score | 0 | 1 | 2 | 3 | 4 |
Learning hook
Demonstrate : Coin toss spreadsheet (XLSM)
This shows how a student met a maths teacher's request for automating the boring task in Year 7 Probability of tossing a coin 100 times (or 100 coins once!) and recording the results.
Show students the formulas (Excel > Formulas tab > Show formulas) and students explain how it works.
Now the user (the Maths teacher) has agreed on the functionality you have shown them, design an improved interface.
Learning map and outcomes
Developing an evolutionary prototype iteratively and incrementally by regularly revising features of an application in response to user feedback and development decisions
Learning input
First outline the need:
A Food Technology teacher has asked you to create an easy-to-use tool for converting temperatures from Fahrenheit to Centigrade, as many US recipes are expressed in Fahrenheit.
You decide to use the Excel spreadsheet application as your prototyping tool.
Note: Please be aware that examples and instructions below use Office for Mac 2011. If you are using a different operating system, the layout may be different.
Demonstrate to students the following as a repeated iterative role-playing narrative based on feedback from an imagined Food Technology teacher, as follows:
Iteration 1 (see Thermometer evolution spreadsheet (XLSX), Sheet 1: C to F)
Student actions (with you performing actions as each step is described):
- Open a new empty spreadsheet
- enter in cell A1 – Temperature Converter
- enter in cell B3 – Celsius
- enter in cell B5 – Fahrenheit
Ask students in the class to find a formula online for this conversion.
Test some values to check that it works (eg freezing of water: 0° C = 32° F, boiling of water: 100°C = 212° F)
Enter formula in cell C5:
= C3 * 9/5 + 32
Students test a few values in cell C3 (the Celsius input box) to check that it works (eg 0° C = 32° F, 100° C = 212° F, etc)
Feedback from Food Technology teacher:
It doesn't work when I type in the Fahrenheit box … I mainly want to convert Fahrenheit to Celsius.
Iteration 2 (see Thermometer evolution spreadsheet (XLSX) Sheet 2: Both ways)
Student actions
- create separate input cells for C and F in C3 and C5, highlight these in yellow and add labels.
- place existing formula: = C3 * 9/5 + 32 in F3
- make F subject of formula: =5/9*(C5-32) and place this in F5
Feedback from Food Technology teacher:
- This is better, but my students will type into the formula boxes F3, F5 and destroy the formula.
- The labels are all over the place, they don't look right.
Iteration 3 (see Thermometer evolution spreadsheet (XLSX) Sheet 3: Protect)
Student actions
- Right-justify cells to tidy up appearance.
- Leave input cells C3, C5 unlocked and all others locked.
(Select all cells > Format… > Cells > check locked checkbox THEN Select only C3, C5 and deselect Locked checkbox THEN Tools > Protection > Protect sheet.)
Note: choices of which cells are locked and unlocked are only active when spreadsheet protection is on.
Feedback from Food Technology teacher:
This is much better, however it is annoying to have to select the text box each time. Can't I use some kind of knob or slider?
Iteration 4 (see Thermometer evolution spreadsheet (XLSX) Sheet 4: Slider)
Note: This worksheet has protection ON but is not password protected.
Student actions:
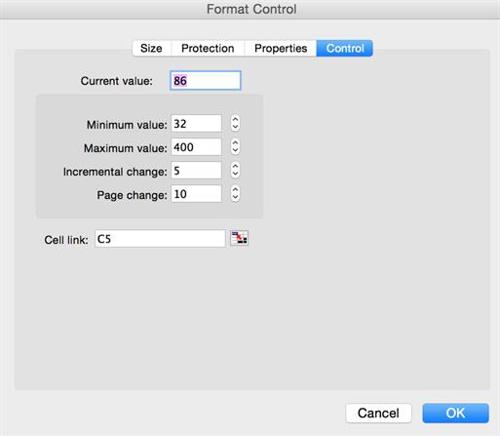
- add two Scroll bar controls: one for Celsius and one for Fahrenheit, right-click, select Format Control > Control
- Minimum and Maximum values, Increments are all set and Cell links to C3 for Celsius input and C5 for the Fahrenheit input are entered for each slider.

- Hide all the things that aren't needed (ie, which make it look like a spreadsheet), eg the gridlines, the row and column headings etc).
Feedback from Food Technology teacher:
- I like the sliders, however having two of them confuses me. (Students now realise that two sliders are no longer necessary.)
- Also, I would like some kind of scale to show what point on the slider I am at.
Iteration 5 (see Thermometer evolution spreadsheet (XLSX) Sheet 5: Thermometer)
Note: This worksheet has protection ON but is not password protected.
Students realise that a thermometer would be a great visual metaphor for the scale on the slider.
By using conditional formatting, cells can be made to change colour when they reach certain values.
Student actions – the following steps are taken:
- The Fahrenheit row and slider are removed.
- Cells D6 to D26 have a reference added =C3 so they will each store the current Celsius value to allow Conditional formatting to be added.
- Student at first tries to "Fill down" this formula after entering it in D6. It changes each row, so student realises needs to use Absolute referencing rather than Relative referencing.
- Changes D6 to =$C$3 and Fills down successfully.
- Checks that slider and values change correctly down the column that will form the thermometer.
- The student now begins adding Conditional formatting: Format > Conditional formatting …
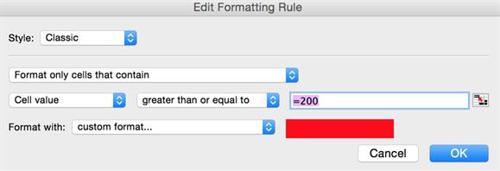
Classic formatting is chosen from the dropdown. - The custom format should be chosen from the dropdown and set to red background fill and red font.
- The following rule is added to D6 ("Cell value greater than or equal to 200"):

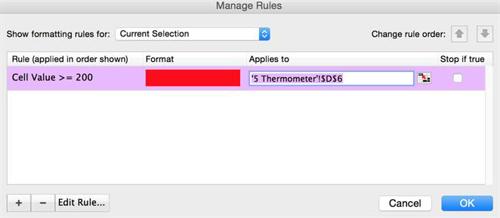
- OK is clicked and the sheet and cell reference are entered in the resultant dialog box ('5 Thermometer'!$D$6):

- This is now repeated down all cells from D7 to D26, with the only difference being the trigger value dropping 10 each time (200, 190, 180, etc).
- Format painter brush can be used to speed this up by copying this Conditional formatting down from D6 to D26, however the trigger values will need to be adjusted manually.
- Select all cells D6 to D26 and turn the text White to make the cell value invisible.
- Overlay cells with a drawn box and a filled circle to represent the bulb.
- Add markers in row to left to indicate temperature in Celsius.
- Unlock cell C3, then lock the spreadsheet (workbook and sheet).
- Grid lines are turned off spreadsheet.
- Lock the spreadsheet.
Feedback from Food Technology teacher:
I love it! My wish list for other improvements would be:
- Add a Fahrenheit scale to right of thermometer.
- Increase the scale for temperature as this only goes to 200 Celsius and ovens are often hotter.
Have students suggest further improvements.
Learning construction
Explain to students that they will now use a spreadsheet to create a tool of their own, using the evolutionary approach to meet a particular user's need.
Choose from the following three options:
- Have students devise a need, and partner with another student to develop the tool, using a spreadsheet.
- Have students ask another teacher (who then becomes the client/user) for suggestions.
- Ask students to select a need from the following suggestions and statements:
- (Science, etc) Another conversion-by-formula spreadsheet such as the temperature one in 'Learning input'.
- (Maths) Spreadsheets can help students understand the relationship between fractions, decimals, and percentages.
- (Social Science) Population growth in a city, state, or country can be examined using a spreadsheet.
- (Maths) Represent other number bases.
- (Maths) Geometry concepts such as perimeter, area, and volume.
- (Science) Position, velocity, and acceleration and the relationships between them.
- (Science, etc) Another conversion-by-formula spreadsheet such as the temperature one in 'Learning input'.
Learning demo
Students show initial and final results to the class and discuss what they discovered about responding to users' feedback.
Learning reflection
Students discuss the benefits and limitations of using a spreadsheet for developing evolutionary prototypes.