A spreadsheet's secret weapon

About this lesson
Students will learn to use pivot tables which have been described as the most powerful tool within spreadsheets.
Year band: 9-10
Curriculum Links AssessmentCurriculum Links
Links with Digital Technologies Curriculum Area
| Strand | Content Description |
|---|---|
| Processes and Production Skills |
Develop techniques to acquire, store and validate data from a range of sources using software, including spreadsheets and databases (AC9TDI10P01) Model and query entities and their relationships using structured data (AC9TDI10P03) |
Assessment
| Quantity of knowledge | Quality of understanding | ||||
|---|---|---|---|---|---|
| Pivot tables | No evidence of understanding | Student is able to find the spreadsheet pivot table tool | Student is able to use the spreadsheet pivot table tool when given the required field entries | Student is able to use the spreadsheet pivot table tool without assistance | Student is able to predict the results of the spreadsheet pivot table tool |
| Optional score | 0 | 1 | 2 | 3 | 4 |
Learning hook
- Provide all students with the spreadsheet file: Pivot tables and advanced filtering (XLSX).
- Have students open the worksheet tab labelled Data 1.
- Give students 10 minutes to try to complete the task of identifying how many episodes each actor was in and what their total earnings were, without using pivot tables.
(Note: students will probably find this tedious. This is the intention! The hook for this lesson is a negative one.) - Point out to students how tedious this process was.
Learning map and outcomes
Despite their ready availability, many students have little sophisticated understanding of spreadsheets. Spreadsheets are used in this lesson to analyse data and to produce information using a relatively little known but remarkably powerful tool: pivot tables. You may wish to discuss the analytical mindset which would be of use to learners in this learning sequence.
Learning input
Tell students:
- You probably found this process frustrating and boring. You were also likely to easily make errors.
Ask them to have a look at the next tab on the sheet: Pivot tables and advanced filtering (XLSX) > Sheet: Pivot table 1A
- Ask the original question from the Learning hook once more:
- How many episodes was each actor was in and what was their total earnings?
Can they see how easy it appears now?
- Using the sheet, Data 1, demonstrate the creation of Pivot table 1A.
- a. Select all the data, including the title and column headings, A1:F31
- b. Select the Data tab and then Click the Pivot table arrow beside the Pivot table icon in the ribbon
Data > Create Manual Pivot table
(If students click Automatic Pivot table by mistake, they can drag the entries out of the boxes and it will leave all fields empty.)


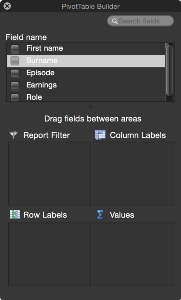
Note: if this Pivot Builder window disappears, it can be switched back on from the ribbon Data > View > Builder

c. In Field names select checkboxes for Surname, Episode and Earnings.
d. Change Values drop downs to read:
- Sum of Earnings and
- Count of episodes
as shown below:

The result appears immediately as a new worksheet.
- Point out that Grand Totals are also generated automatically as shown below:

- Ask for student feedback about their impressions of the potential of this tool.
Learning construction
Set students the task of reproducing the remaining pivot tables provided as examples in the spreadsheet file.
- Ask students to recreate the following two pivot tables:
- Pivot tables and advanced filtering > Sheet: Pivot table 1C
- Pivot tables and advanced filtering (XLSX) > Sheet: Pivot table 1B
- Next direct students to Data set 2:
- Pivot tables and advanced filtering (XLSX) > Sheet: Data 2
They may be familiar with this data set from a previous lesson sequence.
- Students’ challenge here is to create a pivot table showing each Subject and a summary of the Completed column (‘Yes’ or ‘No’) which indicates how often study was finished in the time available.
- Students’ next challenge is to create a pivot table showing:
- Subject
- Count and Type of each session
- a summary of the Completed column (‘Yes’ or ‘No’) which indicates how often study was finished in the time available.
Solutions to these are provided in the files: Pivot tables and advanced filtering (XLSX) > Sheet: Pivot table 2A and Pivot tables and advanced filtering (XLSX) > Sheet: Pivot table 2B
(These two sheets may be removed before providing the file to students.)
Learning demo
- Provide, or develop with students, datasets which are relevant to their interests and activities.
- The Australian Government datasets are an excellent student resource for database work: Australian Government: data.gov.au
These are freely available as .csv files. Select the Datasets tab at top of page.
- For example, see this database on heritage sites: Commonwealth Heritage List – current
- Students develop their own data sets or use one downloaded from Australian Government: data.gov.au
- Have them demonstrate a useful application of pivot tables for their data.
- They must be able to state what the criteria are for which their pivot table is the solution.
Note: check students’ proposed data sets for suitability before they commence.