Data bias in AI

About this lesson
Artificial intelligence can sometimes be biased to certain shapes or colours. When such AI systems are applied to situations that involve people, then this bias can manifest itself as bias against skin colour or gender. This lesson explores bias in AI, where it comes from and what can be done to prevent it.
Year band: 5-6, 7-8
Curriculum Links AssessmentCurriculum Links
Links with the Digital Technologies Curriculum Area.
| Year | Content Description |
|---|---|
| Years 5-6 |
Investigate the main internal components of common digital systems and their function (AC9TDI6K01) Examine how digital systems form networks to transmit data (AC9TDI6K02) Explain how digital systems represent all data using numbers (AC9TDI6K03) Define problems with given or co-developed design criteria and by creating user stories (AC9TDI6P01) Evaluate existing and student solutions against the design criteria and user stories and their broader community impact (AC9TDI6P06) |
| Years 7-8 |
Explain how and why digital systems represent integers in binary (AC9TDI8K04) Investigate how data is transmitted and secured in wired and wireless networks including the internet (AC9TDI8K02) Define and decompose real-world problems with design criteria and by creating user stories (AC9TDI8P04) Evaluate existing and student solutions against the design criteria, user stories and possible future impact (AC9TDI8P10) |
| Year | Strand | Content Description |
|---|---|---|
| Years 5-6 |
Language: Language for interaction |
Understand the uses of objective and subjective language and bias (ACELA1517) |
| Years 7-8 |
Language: Language for interaction |
Analyse how point of view is generated in visual texts by means of choices, for example gaze, angle and social distance (ACELA1764) |
| Year | Strand | Content Description |
|---|---|---|
| Years 7-8 |
Contributing to healthy and active communities |
Evaluate health information and communicate their own and others’ health concerns (ACPPS076)
|
ICT Capability
Typically, by the end of Year 6, students:
Identify the impacts of ICT in society
- Explain the main uses of ICT at school, home and in the local community, and recognise its potential positive and negative impacts on their lives
Select and evaluate data and information
- Assess the suitability of data or information using a range of appropriate given criteria.
Typically, by the end of Year 8, students:
Identify the impacts of ICT in society
- Explain the benefits and risks of the use of ICT for particular people in work and home environments
Select and evaluate data and information
- Assess the suitability of data or information using appropriate own criteria.
Assessment
Teacher assessment
Choose from these suggested assessment approaches and tasks that best suit your students.
| Possible tasks | Relevant content description(s) |
|---|---|
|
(AC9TDI6K01) / (AC9TDI6K02) / (AC9TDI8K02) |
|
(AC9TDI6K03) / (AC9TDI8K04) |
|
(AC9TDI6P01) / (AC9TDI8P04) |
|
(AC9TDI6P06) / (ACTDIP031) |
Learning sequence
Download LessonPreliminary notes
Key terms
| AI | artificial intelligence |
| ML | machine learning |
| ANN | artificial neural network |
| IoT | internet of things |
Tool used in the plugged part of the MyComputerbrain activity
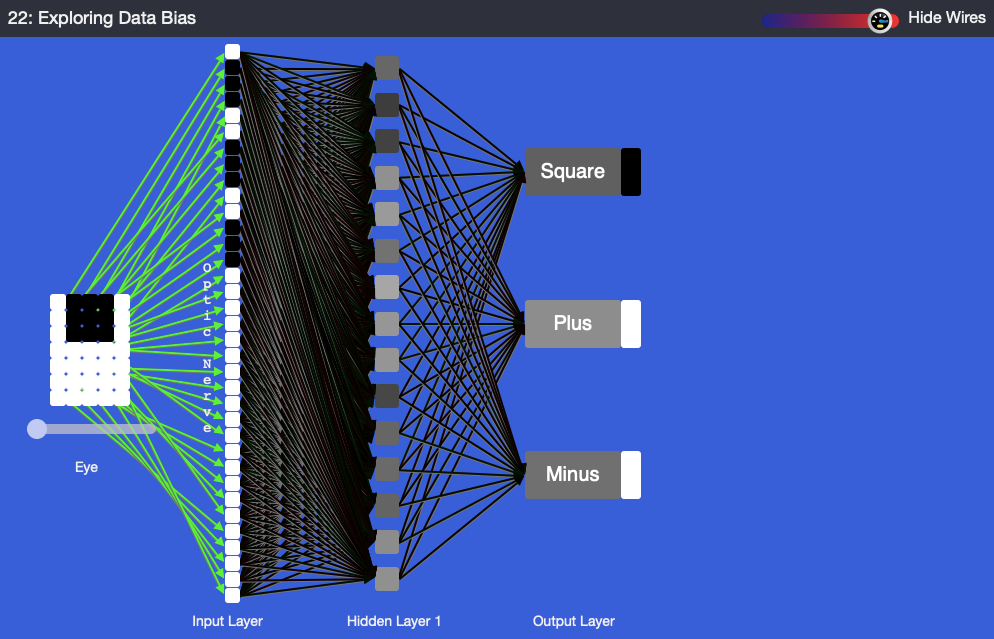
This image shows the view in the MyComputerbrain . The application will classify objects according to their shape and colour. On the right the 'Eye' views the input, on the left we see the output one of the three classifications: square objects, plus signs and minus signs.
The left-hand side of the image depicts an artificial neural network (ANN). The boxes in the input, hidden and output layers are called ‘perceptrons’, which reflect the neurons in the brain. On the left-hand side we observe a 5 x 7 pixel matrix (the eye) that sees the objects that are to be classified. The slider under the eye allows the user to inspect the training data, which consists of the three different images of shapes.
Suggested steps
-
Use this type of activity to lead into a discussion about bias and programming. Ask students to draw a quick sketch of a person from each of these five occupations: court judge, doctor, receptionist, store manager and teacher. Use these sketches to discuss any bias that may have arisen. Examples of bias could be gender or outside appearance including clothing (eg students might associate a doctor with a white coat). When bias is observed, it should be challenged and discussed. Biases are sometimes carried into programming and can present a real issue in training data and creating a model in AI.
-
Discuss the topic of bias. What is bias? What causes it?
In humans, bias can emerge as a result of:
- misinformation or a lack of information
- inability or unwillingness to process available information.
While bias is often seen as a flaw, it is also an important instrument to make sense of data quickly and save brain-processing power.
Explain that our brains are really good at detecting changes. Our senses are delta systems, which means they are hard-wired to notice sudden changes. They are not so good at detecting gradual ones. In vision, this is called ‘slow change blindness’ or ‘selective attention’.
Watch this video on gradual change or the Invisible Gorilla selective attention test.
-
Discuss examples of bias:
- Have you ever seen or experienced bias personally?
- What were your experiences?
- What could be done to counter some biases?
Ask the class if bias is something that only humans experience. Could it perhaps also apply to animals?
Ask the class if they think a computer could be biased. After all, a computer is a machine based on the laws of logic and mathematics. How could a computer be biased?
Plugged activity
In this task, the application lets students interact with an AI application to explore data bias in AI without any coding required by the teacher or students.
The plugged activity explores bias in two parts. Part 1 is about the issue of data bias and part 2 offers a solution to data bias.
Each part consists of the following main steps:
- exploration of training data
- training of the ANN
- testing of the ANN bias
Part 1
Access this link: MyComputerBrain .
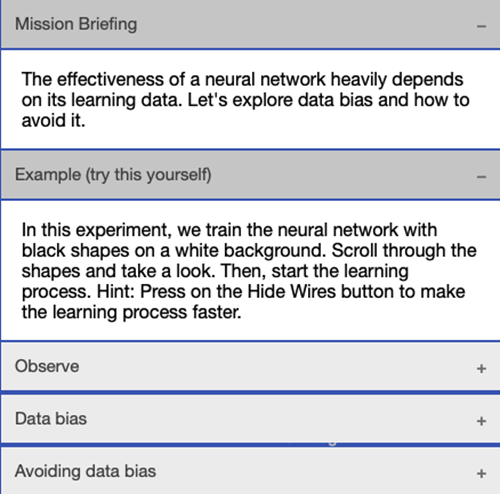
In the first step, the AI is provided with a set of training data that is biased towards black objects on a white background.
The instructions on the right-hand menu of the application will guide students through the process.
| Step | Description | Visual element |
|---|---|---|
| 1a |
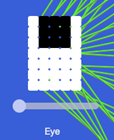
Students scroll through the training data by dragging the slider near the eye from left to right. The students will see three squares followed by three ‘+’ and three ‘–’ signs. Common to them is that the shapes are black and the background is white. |
 |
|
As students drag the slider, they will see a black rectangle move on the output layer to the right of the words ‘square’, ‘plus’ and ’minus’. The rectangles are part of the training data and tell the AI during the training process what the input data should be interpreted as. |
||
| 1b |
Students then click on the Start Learning button at the top of the screen to start the learning process. The learning speed of the underlying AI is independent of internet speed. As it runs locally in the browser, it only depends on local processor speed. On a laptop computer from 2012, the training process takes less than 30 seconds. |
|
|
To see the colour changes of the lines representing the synapses, drag the slider to the left. However, this will slow the learning process. |
||
|
To significantly increase the speed of the learning process, the lines representing the synapses can be hidden by clicking on ‘Hide Wires’ in the menu. |
||
| 1c |
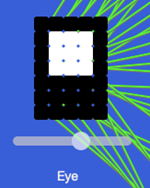
After the learning process is complete, the computer will add further patterns for the eye to see and the AI to classify. These new patterns can be accessed by dragging the eye slider from step 1A above. The new patterns are the same shapes, but this time with white on a black background. |
 |
|
Ask students to observe whether the AI properly classifies these patterns. It doesn’t! Explain that the AI has only learned to recognise black shapes on a white background. It struggles to recognise the inverse (black and white swapped). Our network has a data bias. In the universe of knowledge of this AI, it has never seen white shapes on a black background. |
 |
Part 1 leaves students with the dissatisfaction of seeing that the AI is fallible. Brainstorm ideas that could prevent data bias. Then, begin part 2.
Part 2
This experiment offers a solution to the data bias issue from part 1 above. It does this by including black shapes on white backgrounds and white shapes on black backgrounds in the training data. The training data set is therefore more balanced/inclusive.
| Step | Description | Visual element |
|---|---|---|
| 2a |
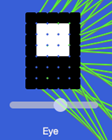
Students scroll through the training data by dragging the slider near the eye from left to right. The students will see three squares followed by three ‘+’ and three ‘–’ signs. Common to them is that the shapes are black and the background is white. By scrolling further, students will see the inverse patterns (white shapes on black backgrounds). |
  |
|
As students drag the slider, they will see a black rectangle move on the output layer right from the words ‘square’, ‘plus’ and ‘minus’. The rectangles are part of the training data and show what the input data should be interpreted as. |
||
| 2b |
Students then click on the Start Learning button at the top of the screen to start the learning process. The learning speed of the underlying AI is independent of internet speed. As it runs locally in the browser, it only depends on local processor speed. Because the training data set is now larger and (from the AI’s perspective) contradicting, the training process will take longer than in step 1B above. On a laptop computer from 2012, the training process will take about 2–3 minutes. |
|
|
To see the colour changes of the lines representing the synapses, use the slider and drag it to the left. Note, however, that this will slow the learning process. |
||
|
To significantly increase the speed of the learning process, the lines representing the synapses can be hidden by clicking on ‘Hide Wires’ in the menu. |
||
| 2c |
After the learning process is complete, the students can check the learning result by dragging the slider under the eye. |
 |
|
Ask students to observe whether the AI properly classifies all patterns. It does! Explain that the AI has now learned to recognise black shapes on a white background and vice versa. It no longer struggles to recognise white shapes on a black background. Our network has overcome its data bias. The AI’s knowledge base has been expanded. |
 |
Discussion
- The second experiment removed the data bias towards black and white objects. But the training data is still biased. It knows nothing of circles, birds, cars, trees, etc. It is important for students to understand that every subset of real-world data is biased in one way or another. A good researcher understands this and will seek to develop data sets that are a fair representation of the real world. In addition, a good designer or engineer will keep in mind the application domain of the technical solution.
- An AI that is deployed in a manufacturing plant to detect imperfections in, let’s say, cogs, does not need to know about birds. To achieve best performance, this AI absolutely needs a biased data set, which is just about cogs and nothing else. Bias can be a desired feature. But keep in mind that the data set about cogs needs to be balanced to recognise a whole range of cogs, not just one particular type or shape.
- Students can modify any shape and let the AI suggest a classification. This is done by clicking on the pixels in the 7 x 5 matrix. In the following image, the plus sign was changed. The AI is much less sure whether this shape is a plus or a minus sign.
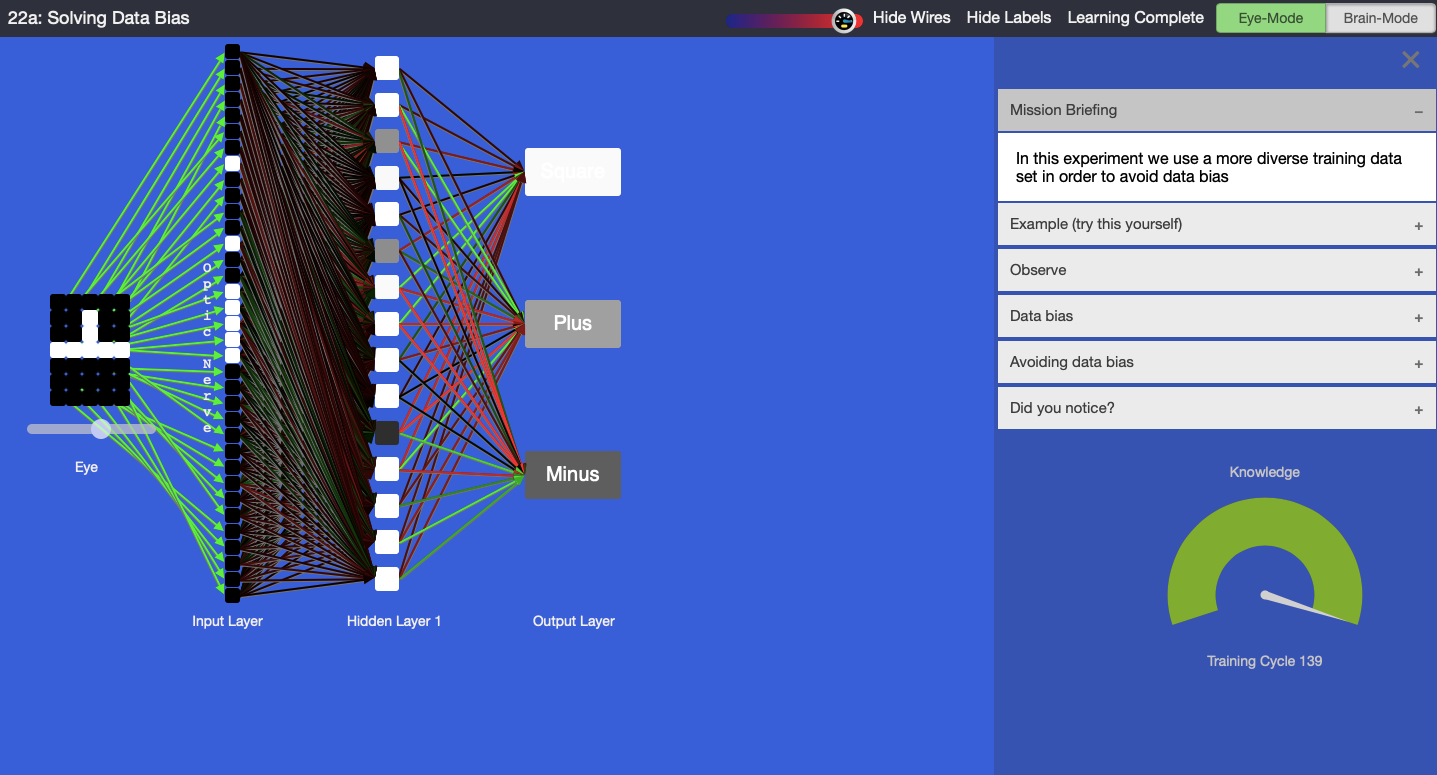
Tool used in the plugged part of the MyComputerbrain activity (AI not quite sure)
- When the AI has been trained, highlight the level of shading of the three output perceptrons of the ANN, which represent the confidence level. Hover over any of the output perceptrons to display a pop-up that shows the perceptron’s internal values. Discuss the scale. If the box is fully black, this means that the AI was very sure, whereas a light grey means that it was not quite sure. When was the AI very sure of its guess? When was it not so sure? In the example below, the AI is 0.97 sure that the shape is a square.
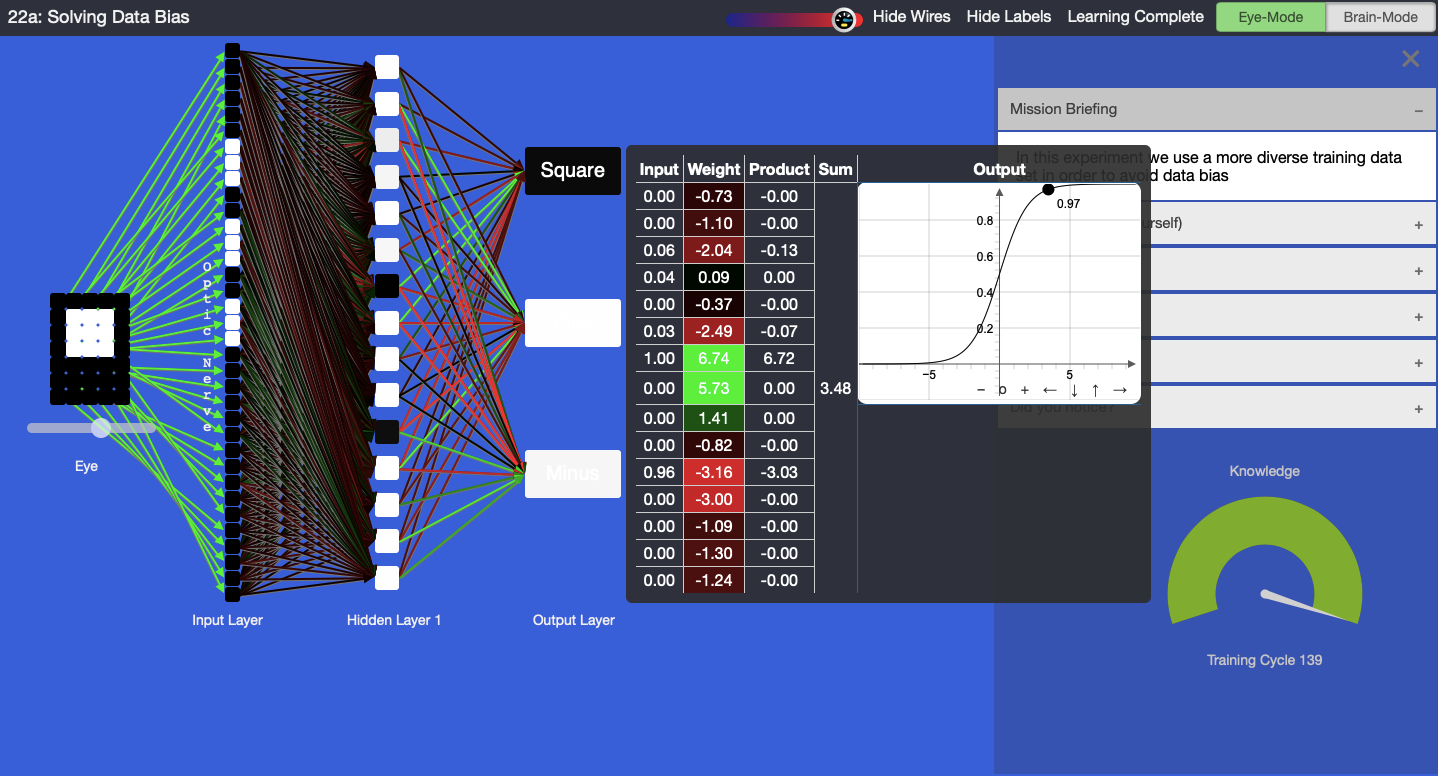
Confidence level
- Observe the table with input, weight, product, sum and output. Each perceptron receives input data from other perceptrons. Multiply each input with a weight, leading to a product. The products are added up to achieve a sum and then pushed through a function that determines the output of the perceptron. Notice that the mathematics is not very difficult, but quite effective. Hover your mouse over any perceptron to check its data. Observe that the colour of the lines that connect to the input of a perceptron on its left correspond to the colours in the ‘Weight’ column in the table.
- Let students visually compare the ANNs on their computers. Note that the colours of the lines will be different among ANN instances. Each ANN is unique. The reason is that each ANN started with different random values in the synapses, represented in the weight column in the above image. If we had assigned the same value to each weight at the start, then the ANN could not have learned. The learning process leverages these small differences for a successful learning outcome
- Reset the experiment and retrain the ANN. Observe how the colours of the lines change as the AI learns. Green means positive values, red means negative values and black is neutral (close to zero). These lines correspond to the synapses in our brains and they regulate the data flow between the perceptrons.
- Is green more valuable to the learning than red or black? No, they are all equally required for the learning outcome.
-
Note that the pixels from the training data are provided to the ANN as binary numbers. The ANN-internal representations of the shapes are 1’s and 0’s. 1 is ‘on’ and displayed as a black pixel; 0 is ‘off’ and displayed as a white pixel.
Background note
The function depicted above is a Sigmoid-function: f(x)= 1 / (1 + e^(-x)). The ANN also uses the derivative of the Sigmoid function during the learning process: df(x)/dx = f(x) * (1 - f(x))
To learn more about ANNs, explore the other experiments in this course at https://mycomputerbrain.net/php/courses/ai.php. The first experiment is free and provides a good introduction to ANNs.
Why is this relevant?
Artificial intelligence is the ability of machines to mimic human capabilities in a way that we would consider 'smart'.
Machine learning (ML) is an application of AI. With ML, we give the machine lots of examples of data, demonstrating what we would like it to do so that it can figure out how to achieve a goal on its own. The machine learns and adapts its strategy to achieve this goal.
In our example, we are feeding the machine with images. The more varied data we provide, the more likely the AI system will correctly classify the input as the appropriate output. In ML, the system will give a confidence value; in this case, a decimal value between 0 and 1 and the output box coloured with white, shades of grey, or black. The confidence value provides us with an indication of how sure the AI is of its classification.
This lesson focuses on the concept of bias and classification. ‘Classification’ is a learning technique used to group data based on attributes or features.