Data detective

About this lesson
In this sequence of lessons students conduct a simple survey to collect, organise and present data. In doing so, they demonstrate their understanding of how to use patterns to represent data symbolically.
Year band: 1-2
Curriculum Links AssessmentCurriculum Links
| Strand | Content Description |
|---|---|
| Knowledge and Understanding |
Represent data as objects, pictures and symbols (AC9TDIFK02). Represent data as pictures, symbols, numbers and words (AC9TDI2K02). |
| Learning Area | Strand and Content Description |
|---|---|
| Mathematics | Data representation and interpretation Create displays of data using lists, table and picture graphs and interpret them (ACMSP050). |
Assessment
It is important from a Digital Technologies perspective that students develop skills and understandings related to organising and visualising data. Use relevant assessment strategies to assess the extent to which students can:
- Describe different ways data can be displayed.
- Give reasons why data is displayed in different ways.
- Interpret data represented in different formats, tables, pictograph and column graph.
- Describe ways they can use a computer to organise and display data.
Learning hook
- Pose the question to students: 'What is the most common pet for students in the class?'
- Invite students to respond to the following questions:
- 'How can we find out which animal is the most common pet for students in the class?'
- 'What do we need to do to find the answer?'
- Encourage students to consider effective methods of collecting and usefully recording information by asking the following:
- 'Who needs to be asked?'
- 'What do we need to ask them?'
- 'How would we remember the information that we gather?'
- 'How should we collect the information so that we can remember it?'
- Divide the class into small groups and provide time for each group to plan a method for collecting and recording the information.
- Re-group and invite each group to share its ideas. Display the suggestions and name them Methods for Collecting Data.
- Pose the question to students: ‘What is data?'
- Use the 'What is Data' PowerPoint provided to explain the term 'data':
- Data can be numbers, images, text, sound.
- When data is turned into information it can be used to make decisions.
- Text and number data can be collected.
- Data can be organised (put into groups) to make it meaningful.
- Refer to the students’ ideas about collecting and recording data for their investigation about pets.
- Discuss each group's method of collecting data
Learning map and outcomes
Share the learning intentions with the class. (Language and terms used will vary according to year level.) Tell students that they will:
- conduct a simple survey to collect responses from friends
- record the survey responses using tally marks, numbers of pictures
- organise the data using tables and lists
- share findings through displays that use the computer to present data in a creative way.
You could also focus on the skillset and mindsets that learners need to adopt and use during this project, this ties in with the Creative and Critical Thinking Capabilities.
Learning input and construction
- Refer to the earlier pet investigation task and the list that was created. Remind students about the importance of deciding on the best method for collecting the data.
- As a class, decide on the most efficient method for collecting the information. Suggested questions for the students:
- 'How many categories do we need?'
- 'Do we need one category for every pet?'
- 'How can we make sure everyone has given us an answer?'
- 'How will we know if someone has a pet that is the same or different from someone else's in the class?'
- 'Do we have to know which pet belongs to whom?'
- 'If someone has more than one cat, should we count that as one or two in the cat category?' Divide class into small groups (whose size will be dependent on context) and ask students to collect the information from the members in their group using an agreed method. The collection method may differ according to age of students. Provide worksheets / tables as required, for example, see the resources section.
Try using some of the questioning methods and thinking routines here in order to ensure all learners are engaged in discussion and demonstrate their thinking.
- Create the record sheet/table for data collection
(For a Foundation/Year 1 class)
Create a record sheet similar to Record sheet: Example 1
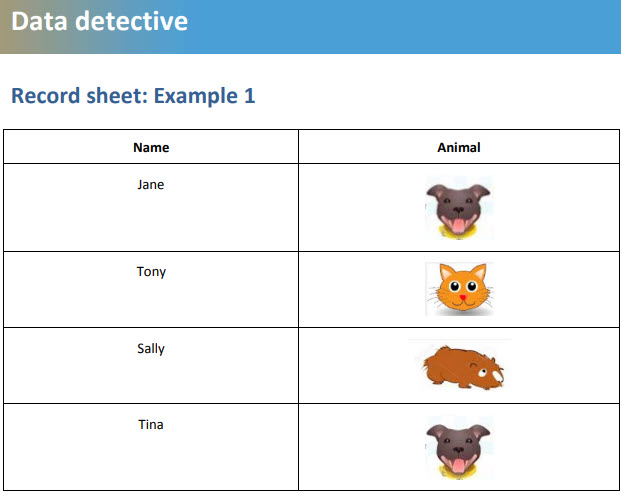
Ask students to select an image or toy and place it next to their name within the sheet.
(For a Year 2 class)
Students could use a table to collect and tally information. Support students to arrive at the conclusion that tally marks will be an efficient method of recording.
Organising data
- Support each group to determine the most common animal within their group.
- Ask groups to come together as a class. Explain that the next task involves collating the total number within each pet category. Ask students how this might be undertaken
Learning demo
Displaying data
- Explain that there are many different ways to present data. For example, we can use colours, shapes, pictures or numbers to present our data so that people can see patterns.
Model the following different methods that can be used.
As you do, ask students to identify the types of data being collected.
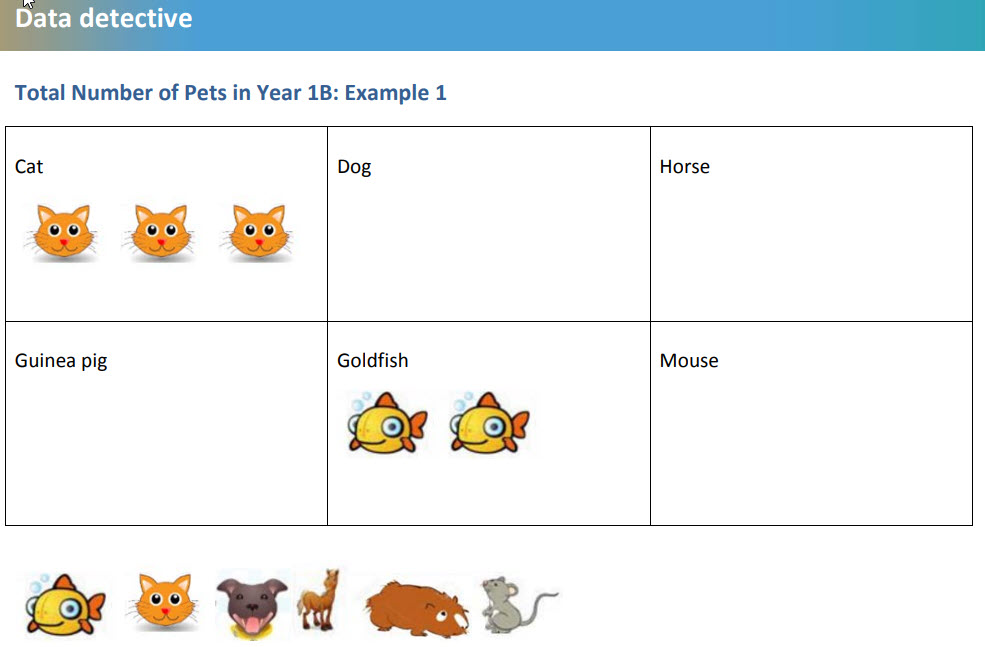
Example 1
Students draw the correct number of animal images within each category.
Total Number of Pets in Year 1B (PDF)
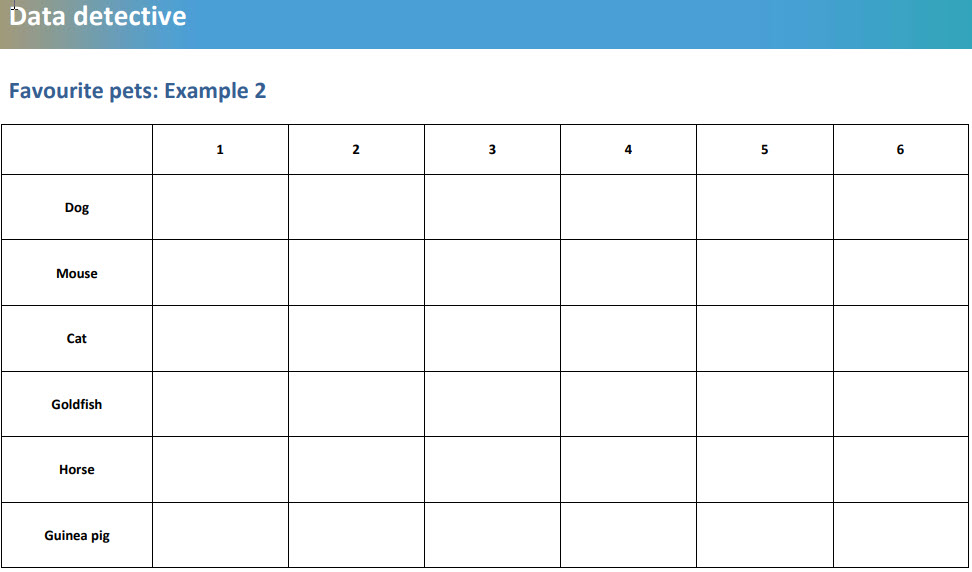
Example 2
Students use the table and colour the squares to create a column graph.
Learning construction 2
Use digital systems to present data
- Ask students the following questions:
- ‘How could we use a computer to display our findings?’
- ‘What software/tools/devices would be best to use?’
- Explain that digital systems can help to:
- organise data
- display data creatively (help us share our data in a clear way)
- make meaning from data.
- Demonstrate how data can be displayed digitally.
- Model the creation of a bar graph, pie chart or digital picture graph/pictograph. If possible use an interactive whiteboard.
- Whenever possible, support students to use common software, apps or chart- and graph- making tools to present their data creatively (for example as a slideshow, picture graph, bar graph or pie chart). See the Resources section for software. For example:
- PowerPoint
- Word
- Microsoft Excel
- Teaching Graphs App.
- This task could be undertaken with students working in pairs or small groups or could run as a whole-class activity, and will be dependent on resources and support available.
- Alternatively, students from higher year levels could be buddied with younger students to undertake this task.
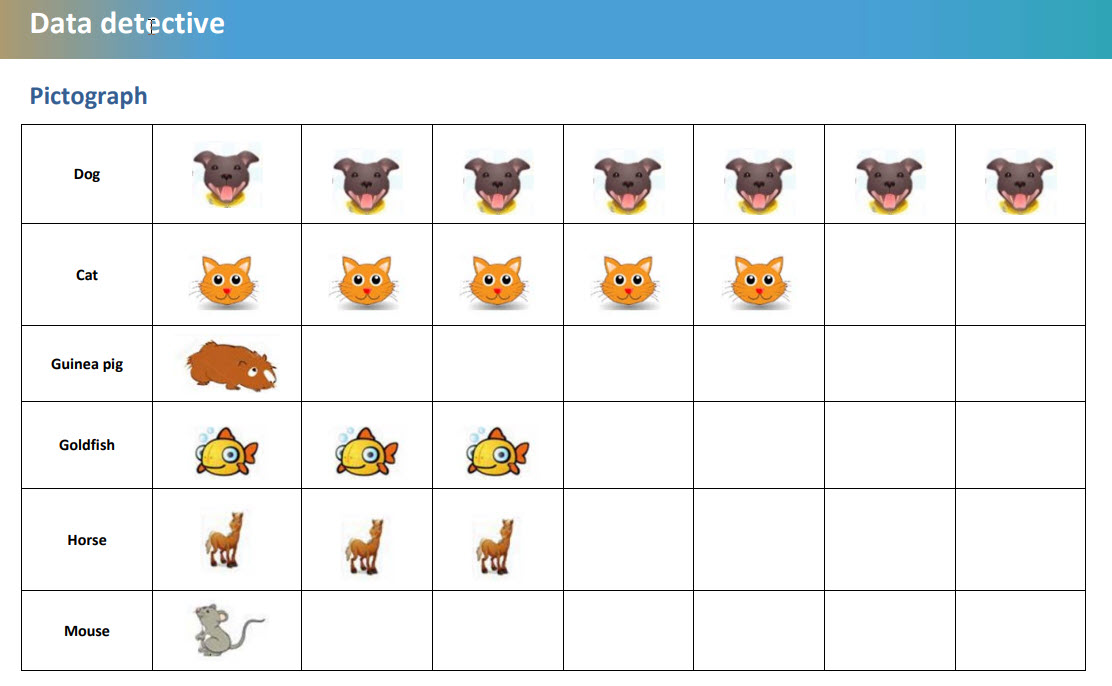
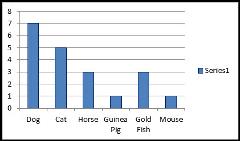
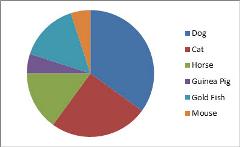
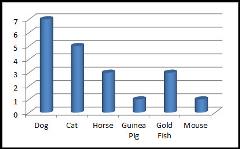
See the following examples of charts and graphs based on the class pets task above, created with the tools in Resources.
Picture graph/Pictograph (PDF)
Vertical bar chart/graph
Pie chart
Vertical bar chart/graph (cylinders)
Students can present their data display to the class and provide an explanation of
- how they collected their data,
- why they chose to present it the way they did
- anything that they found surprising or unexpected about the data
- what they might do differently next time
Learning demo (extension)
- Display students' charts; drawings; picture graphs; pie charts, tables.
- Ask the students to consider the following questions:
- 'Is it easier to answer the question about which pet is more popular by looking at the picture graph, table, pie chart or bar graph?' 'Why do you think this pet is the most common?'
- 'Would all classes in the school have the same answer to the question: What is the most common pet?'
- 'Which pet do you think would be the most common across the whole school? Why?'
- 'Would you change the way you represented your findings if you were to do it again? Why or why not?
