Weather forecast from the stratosphere

About this lesson
The project is based on a real world problem and a real data set from a weather balloon launched in Australia earlier this year. The project consists of 5 lessons of variable length, each with a different focus. The lessons are mapped to Digital Technologies outcomes, with a strong association to the science outcomes for water cycles in year 7.
Year band: 7-8
Curriculum Links AssessmentCurriculum Links
Links with Digital Technologies Curriculum Area
| Strand | Content Description |
|---|---|
| Processes and Production Skills |
Select and use a range of digital tools efficiently and responsibly to share content online, and plan and manage individual and collaborative agile projects (AC9TDI8P12). Define and decompose real-world problems with design criteria and by creating user stories (AC9TDI8P04). |
Links with the Science Curriculum Area
| Strand | Content Description |
|---|---|
| Science Understanding/ Science as a human endeavour |
Some of Earth’s resources are renewable, including water that cycles through the environment, but others are non-renewable (ACSSU116) Solutions to contemporary issues that are found using science and technology, may impact on other areas of society and may involve ethical considerations (ACSHE120) |
Assessment
F-2 Checklist
| With Support | Independently | |
|---|---|---|
| Understand that data is transferred from the human to the robot | ||
| Interacts with different digital toys and experiments with their functions | ||
| Understands the robot as a model of an imaginary digital system | ||
| Explains the features of the design of the robot | ||
| Provides instructions to the robot to move in an intended manner | ||
| Describes the steps involved in a process | ||
| Gives instructions in a sequence | ||
| Considers how to keep the human robot safe | ||
| Discusses how robots might be used in our lives | ||
| Creates an image understanding it will be seen online |
5-6 Checklist
| With Support | Independently | |
|---|---|---|
| Explains the robot as a digital system and having internal and external components that perform different functions | ||
| Explains how the data is transmitted between the F-2 student and the robot | ||
| Recognises that algorithms can be represented by using codes | ||
| Uses knowledge from explored robots and features that are transferable to their robots | ||
| Understands the robot front is a user interface | ||
| Considers how the user can input data irrespective of language background | ||
| Creates a design with labels and captions | ||
| Follows a diagram of instructions | ||
| Creates a flow chart or diagram with clearly defined decisions, processes, inputs and outputs | ||
| Designs the instructions for the robot | ||
| Designs and creates an algorithm which is interactive | ||
| Uses language such as ‘if’ and ‘then’ to explain how the robot works | ||
| Explains how people will interact with the robot easily | ||
| Considers the knowledge of team members when making decisions | ||
| Works collaboratively to design and build a website |
Learning hook
What's the problem?
-
For this project work it is advised that students work in groups of 3 where practical. Provide each group with the Project Outline. The project outline is a request for help to analyse data from a weather balloon launch to determine the likelihood or rain. It explains there was a problem gathering cloud data; usually a key piece of data to determine the likelihood of rain.
-
Watch the video Features Not Standard: Weather Balloon Launch and Recovery! (10 minutes)
Explain that students will be working with data from a weather balloon launch in regional Victoria. Weather balloons are used daily around the world to provide the input data for our weather forecasting tools. You may also want to show the video GoPro Weather balloon Stratosphere Flight! Short Version (3 min) which shows the view from a height of 30km in the sky (stratosphere).
-
To assist students with their team work you can set the Team agreement as a homework assignment. The aim for this activity is to focus on how they will work together, and think about whether they have formed a well-rounded team.
-
Brainstorming Activity (20 minutes)
In their groups, have students come up with 5 environmental things that might also be affected by global warming, which can be monitored through the atmosphere. Use the Brainstorming scaffold. The brainstorm covers the following questions:
What might be ways the atmosphere affects us on Earth?
Possible Answers: rain, storms, radiation protection, oxygen production from trees, heating and cooling, transportation.
How do we interact with the atmosphere?
Possible answers: receive sunlight, hear sound, air transportation, pollution emissions, fire and burning, breathing, sunburn/skin cancer, etc
What might benefit from monitoring the atmosphere?
Possible answers: Holes in the ozone, Radiation, Changes in the magnetic field, Global warming, Weather patterns, Oxygen production from forests, Wind patterns, Volcano eruptions, Hazardous factory pollution, Carbon emissions, Rainfall and snow
Learning map and outcomes
Throughout this learning sequence students will work in their group to analyse weather data to solve a problem
Throughout this process they will learn:
- how to become familiar with the problem they are solving.
- apply their understanding of the water cycle and key terminology and vocabulary
- how to start an analysis of a data set and identify relevant information to help analyse data
- to use Excel to make calculations across large data sets
- draw meaningful conclusions from their data analysis.
Learning input
Earth's atmosphere
Refresh student understanding of the water cycle using the video The water cycle | Ecology | Khan Academy. (10 minutes) or use the Water cycle interactive on the NASA website.
Test students understanding of the water cycle using the Water cycle worksheet. You may decide to set this as a homework task.
How do we use the water cycle in our everyday life?
To give context to the problem, and show the relevance of the project to the students’ lives, we want the class to discuss how the water cycle affects them.
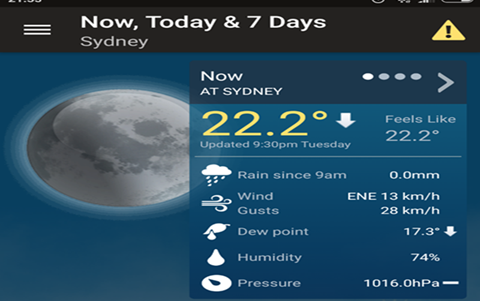
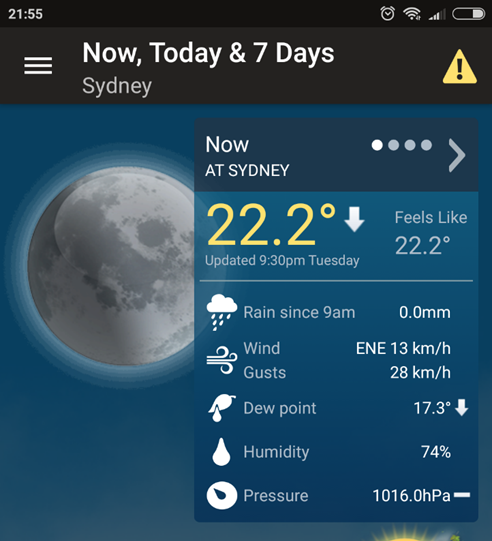
We suggest you talk about their mobile phone’s weather app. Most weather forecast apps talk about humidity levels near the chance of rain. You can discuss how someone collects humidity data in your city/town, it’s uploaded to a database and used to create a forecast about rain.
Show students that the app includes humidity as a %. Explain that people use this information to know what to wear, how ‘muggy’ it will be and if it’s likely to rain. Observe the forecast on different days and see if the humidity percentage correlates to the likelihood of rain.

Learning construction
Finding relationships in data
Discuss the use of data analysis in industry and that this session is about learning and using some important skills to look for relationships and patterns in data.
Using a data projector, display the Weather data set that students will be using for this analysis so that they are familiar with the format of the data. Explain each column and what it means.
Barometric reading: Data series (rows 2 to 83)
- Column A contains a timestamp called “UNIX”. This is a particular way of stating time. The corresponding time is found in Colum B. For the sake of simplicity, will use Colum B for our analysis.
- Column C contains barometric pressure.
- NOTE the recorded data is incomplete for the balloon flight.
Humidity and temperature readings Data series (rows 87-2269)
- Column A contains a timestamp called “UNIX”. Use the corresponding time in Column B for our analysis.
- Column C contains Humidity data measured as a %.
- Column D contains Temperature and is recorded in Degrees Celsius.
Discuss with students how they think they can tell if there are clouds in the sky using temperature and humidity data, refer back to the mobile app weather data discussion.
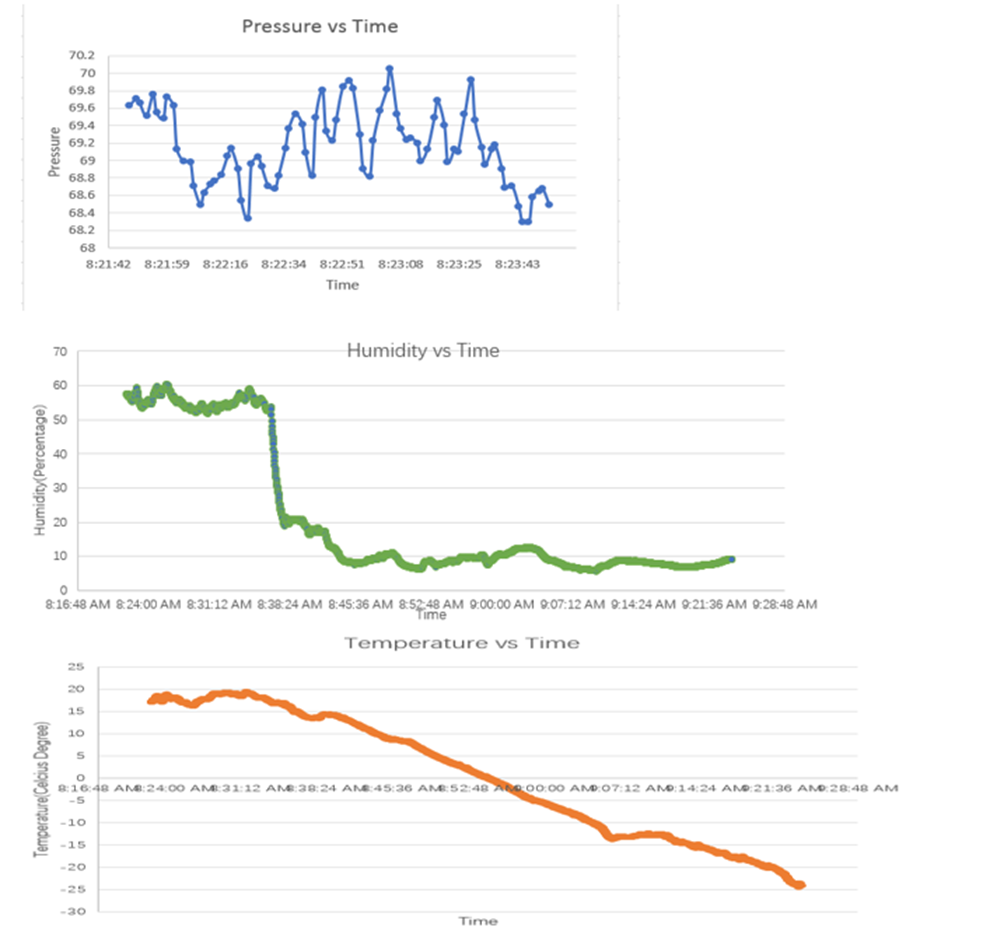
In their groups, have students work through the Excel Analysis guide. They will need access to computer or tablet devices, the data set and spreadsheeting software such MS Excel or similar. The guide shows students how to graph data to help them to more easily understand what is happening and compare how humidity, pressure and temperature change over time. The most useful plot for this dataset is a scatter chart.
Students create a Scatter chart of humidity vs time, pressure vs time and temperature vs time.

Learning demo
In groups, have students work through the Results Worksheet. This worksheet guides them to think critically about their results and the implications. Students consider correlation, causation and any improvements or further information that could be useful to make more conclusions
Students use relevant digital technologies such as presentation software to make a slide deck of their analysis. Students describe their analysis and what they believe the results to indicate.
Learning reflection
Discuss the use of a spreadsheet for data analysis.
What have they learned and how did this assist in their data analysis?
Challenge students to think creatively about improving the process and experiments. You can encourage them to think about the problem from a sustainability perspective, automation perspective or even reliability.