Sample assessment tasks
Browse the following assessment resources organised by Year band.
F-2
Use the slide sorter function to arrange a set of presentation slides in correct sequence to retell a fairytale.
Fairytale Fun
Use the slide sorter function to arrange a set of presentation slides in correct sequence to retell a fairytale.
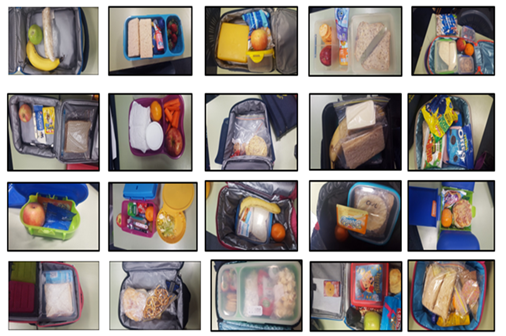
Lunch box data
Use this assessment task to explore data collection, analysis and presentation.
Years 3-4
Provide students with a dataset represented in two different ways, for example as an image and also as a combination of text and numbers in a table. Ask questions about the data to assess students level of understanding. Teachers use the checklist provided to assess students and record observations.
Years 5-6
Students are given a bitmap image made up of coloured pixels. They explain how the image is made up of binary digits that represent each pixel. Students represent 8 colours using binary digits. Teachers assess the student’s demonstrated knowledge/skills using the checklist provided.
Pixels and binary digits
Students are given a bitmap image made up of coloured pixels.

Network infographic
In this assessment task, students demonstrate their ability to distinguish between different types of networks and defined purposes.
Years 7-8
In this assessment task, students demonstrate their ability to distinguish between different types of networks and defined purposes.
Years 9-10
This sample assessment task has been prepared to assist teachers with the implementation of the Australian Curriculum: Digital Technologies, with a particular focus on data.

ACARA sample assessment task (9-10)
This sample assessment task has been prepared to assist teachers with the implementation of the Australian Curriculum: Digital Technologies, with a particular focus on data.